
Rough surface generation & analysis
Surface roughness is a measure of the topographic height variations of the surface. The roughness can arise from polishing marks, machining marks, marks left by rollers, dust or other particles and is basically shaped by the full history of the surface from the forming stages (casting, sintering, rolling, etc.) to the finishing processes.
Rough surfaces are commonly divided into the subcategories of deterministic and random surfaces. Deterministic surfaces have a pre-scribed shape, usually of a simple form such as triangular, rectangular or sinusoidal and are as such easily implemented in surface modelling applications albeit perhaps lacking somewhat in realism. Random surfaces, on the other hand, are stochastic and a result of a random process (or several) and are usually characterized using terms from probability theory such as the height distribution function (hdf) or the statistical moments of mean, variance (or rms height [s]), skewness and kurtosis. The surface variation in the lateral directions are described by the autocovariance function (acf) which describes the covariance (correlation) of the surface with translationally shifted versions, where the correlation length (t) is the typical distance between two similar features (e.g. hills or valleys).For modelling and simulative purposes random rough surfaces with Gaussian statistics can be generated using a method outlined by Garcia and Stoll [1], where an uncorrelated distribution of surface points using a random number generator (i.e. white noise) is convolved with a Gaussian filter to achieve correlation. This convolution is most efficiently performed using the discrete Fast Fourier Transform (FFT) algorithm, which in MATLAB is based on the FFTW library [2].
Matlab code
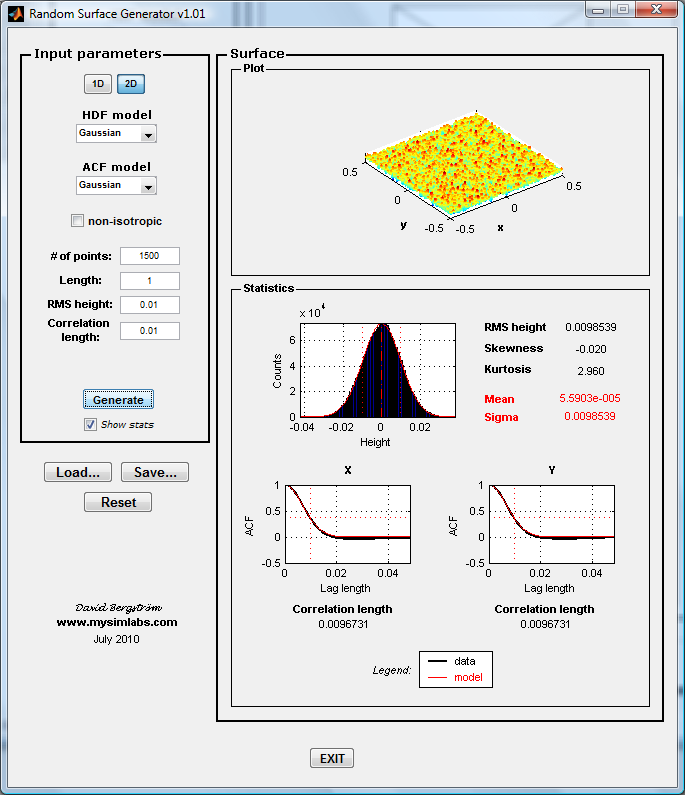
NEW! GUI for generation and analysis of 1D and 2D random rough surfaces.
RSG (v1.01)INPUT: Surface points, length of surface, rms height, correlation length(s), hdf and acf.
OUTPUT: Surface plots, hdf and acf, rms height and correlation length(s) with comparisons to model values. Options also exist for saving and loading surfaces.
REQUIREMENTS: MATLAB, Statistics and Signal Processing Toolboxes.
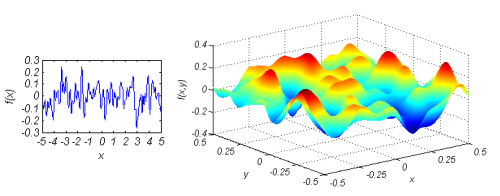
Surface Generation
[f,x] = rsgeng1D (N,rL,h,cl)INPUT: N-number of surface points, rL-length of surface, h-rms height, cl-correlation length
OUTPUT: f-surface heights, x-surface points
The Nyquist sampling theorem sets a lower limit of the sampling frequency (N/rL) of the surface. Use at least a sampling frequency > 2/cl to get the correct correlation length (cl) of the surface from the surface generation algorithm. To achieve adequate gaussian statistics use a ratio of surface length to correlation length rL/cl > ~500. You can always use the analysis code (see below) to verify the statistical quality of your surface profile.
[f,x,y] = rsgeng2D (N,rL,h,clx,cly)
INPUT: N-number of surface points, rL-length of surface side, h-rms height, clx-correlation length in x, cly-correlation length in y
OUTPUT: f-surface heights, x-surface points, y-surface points
Again, the Nyquist sampling theorem sets a lower limit of the sample frequency of the surface to achieve the correct correlation length, see above (in this case the sampling frequency is referred to the sampling along one of the square sides of the surface). To achieve proper gaussian statistics in the 2D case use a ratio of surface length to correlation length rL/cl > ~70. Again, please use the analysis code to check the quality of your surface and verify that you got what you asked for.
[f,x] = rsgene1D (N,rL,h,cl)
INPUT: N-number of surface points, rL-length of surface, h-rms height, cl-correlation length
OUTPUT: f-surface heights, x-surface points
[f,x,y] = rsgene2D (N,rL,h,clx,cly)
INPUT: N-number of surface points, rL-length of surface side, h-rms height, clx-correlation length in x, cly-correlation length in y
OUTPUT: f-surface heights, x-surface points, y-surface points
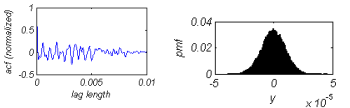
Surface Analysis
[acf,cl,lags] = acf1D (f,x,opt)INPUT: f-surface heights, x-surface points, opt-optional parameter (type 'plot' for plotting the normalized autocovariance function), lags-lag length vector
OUTPUT: acf-autocovariance function, cl-correlation length, lags-lag length vector
[acfx,clx,acfy,cly,lags] = acf2D (f,x,y,opt)
INPUT: f-surface heights, x-surface points, y-surface points
OUTPUT: acfx-autocovariance function in x direction, clx-correlation length in x direction, acfy-autocovariance function in y direction, cly-correlation length in y direction, opt-optional parameter (type 'plot' for plotting the normalized autocovariance functions), lags-lag length vector
[hdf,bc,h] = hdf1D (f,b,opt)
INPUT: f-surface heights, b-number of bins, opt-optional parameter (type 'hist' for drawing histogram, type 'plot' for continuous plot)
OUTPUT: hdf-height distribution function, bc-bin centers, h-rms height
[hdf,bc,h] = hdf2D (f,b,opt)
INPUT: f-surface heights, b-number of bins, opt-optional parameter (type 'hist' for drawing histogram, type 'plot' for continuous plot)
OUTPUT: hdf-height distribution function, bc-bin centers, h-rms height
References:
[1] Garcia, N.; Stoll, E.: "Monte Carlo Calculation of Electromagnetic-Wave Scattering from Random Rough Surfaces", Physical Review Letters, Volume 52, Issue 20, pp. 1798-1801 (1984).
[2] FFTW library - free collection of fast C routines for computing discrete Fast Fourier Transforms. Developed at MIT by Matteo Frigo and Steven G. Johnson.